Mastering Candlestick Pattern Detection
Discover candlestick pattern detection strategies, real-world trading examples, and tools for smarter technical analysis.
Candlestick patterns are one of the most widely used tools in technical analysis. They visualize market sentiment and can indicate potential reversals or continuations in price action. Nexo Mechanics introduces an advanced TradingView indicator that detects 13 classic candlestick patterns, validates them using volatility filters, and displays them directly on your chart. We’ll break down every single pattern with explanations and example screenshots, so you can understand both the theory and how it looks in real market conditions.
Nexo Mechanics’ Candlestick Pattern indicator is designed to go beyond basic pattern recognition by adding intelligent market context and validation. Instead of flagging every textbook formation, the indicator applies ATR-based volatility validation, ensuring that patterns are only detected when the candle’s price range exceeds a configurable multiple of Average True Range. This helps filter out low-volatility noise and focus on meaningful price action.
An optional RSI filter further refines signal quality:
Bullish patterns are displayed only when RSI is below a user-defined oversold level
Bearish patterns are displayed only when RSI is above a user-defined overbought level
To accommodate different markets and trading styles, the indicator also offers customizable pattern thresholds:
Doji body threshold, allowing precise control over how small the candle body must be to qualify as a Doji
Marubozu wick threshold, defining how minimal upper and lower wicks must be for a valid Marubozu pattern
Together, these filters help traders focus on higher-quality candlestick patterns that align with volatility conditions and momentum context, rather than relying on raw visual recognition alone.
Bullish Patterns
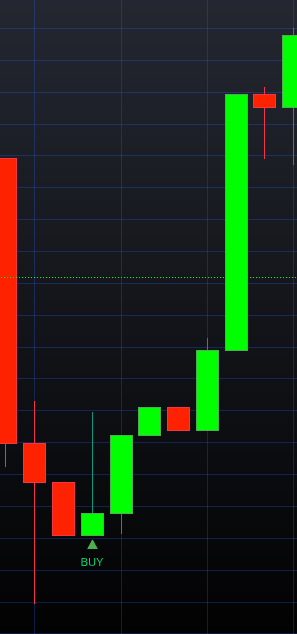
Inverted Hammer Pattern
What it is
A single-candle reversal formation that appears after a downtrend, characterized by a small real body and a long upper wick.
Market psychology
The pattern reflects early buying pressure following a selloff, signaling that buyers are beginning to challenge bearish control and that a potential reversal may be developing.
Indicator logic
The pattern is confirmed only when the candle’s range exceeds the defined ATR threshold, ensuring sufficient volatility. When the RSI filter is enabled, the signal is further restricted to conditions where momentum indicates oversold market levels.

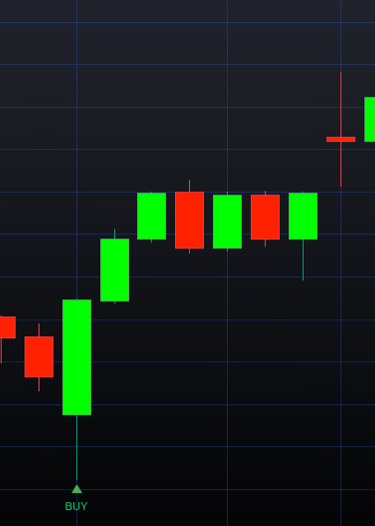
Bullish Engulfing
What it is
A two-candle reversal pattern where a strong bullish candle completely overtakes the body of the preceding bearish candle.
Market psychology
The pattern reflects a decisive shift in market control, as buyers step in with enough conviction to absorb prior selling pressure. It commonly appears near potential market bottoms.
Indicator logic
Signals are displayed only when the engulfing candle meets the ATR-based volatility requirement. If enabled, the RSI filter further limits signals to oversold conditions.
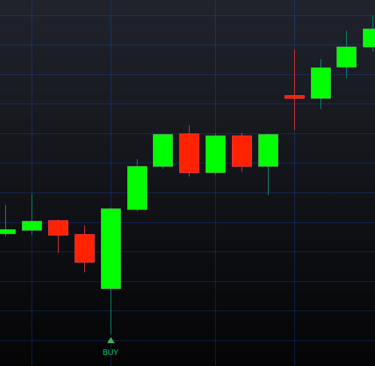
Morning Star
What it is
A three-candle reversal formation consisting of a strong bearish candle, followed by a small-bodied indecision candle, and then a decisive bullish candle.
Market psychology
The pattern reflects selling pressure losing momentum, followed by renewed buyer conviction, often marking the early stages of a potential trend reversal.
Indicator logic
The pattern is confirmed only when the final bullish candle meets the ATR-based volatility threshold. If enabled, the RSI filter restricts signals to oversold conditions.
Bearish Patterns
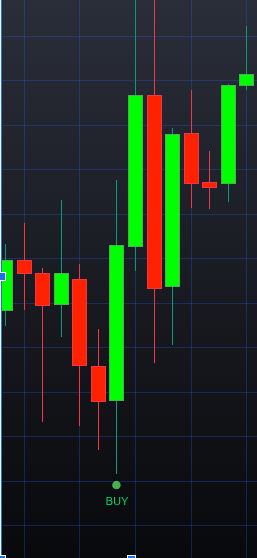
Pin Bar
What it is
A single-candle reversal pattern characterized by a long upper wick, indicating strong rejection of higher prices.
Market psychology
The formation reflects aggressive selling pressure emerging at elevated price levels, suggesting potential exhaustion of buyers.
Indicator logic
The pattern is displayed only when the candle's range exceeds the ATR-based volatility threshold. When enabled, the RSI filter restricts signals to overbought conditions.

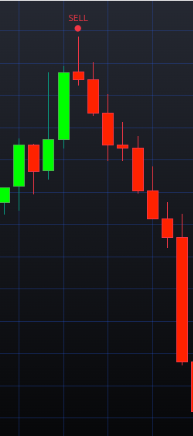
Bearish Engulfing
What it is
A two-candle reversal pattern in which a strong bearish candle completely engulfs the body of the preceding bullish candle.
Market psychology
The formation signals a decisive shift in market control, as selling pressure overwhelms prior buying interest, often near potential market tops.
Indicator logic
The pattern is displayed only when the engulfing candle meets the ATR-based volatility requirement. If enabled, the RSI filter restricts signals to overbought conditions.
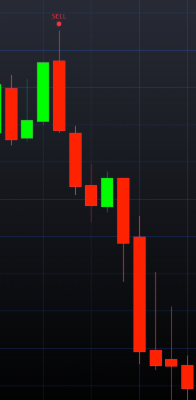

Evening Star
What it is
A three-candle reversal formation that mirrors the Morning Star, typically appearing after an uptrend and signaling a potential market top.
Market psychology
The pattern reflects buyer momentum fading, followed by increasing selling pressure as control shifts to sellers.
Indicator logic
The pattern is confirmed only when the final bearish candle meets the ATR-based volatility threshold. If enabled, the RSI filter restricts signals to overbought conditions.

This article covered three bullish and three bearish candlestick patterns available in the Nexo Mechanics Candlestick Pattern indicator, which is included just below. The indicator includes additional pattern types beyond those shown here, which are not covered in this post. Thanks for taking the time to read, and may you have successful trades!