
Williams 13%R and 52%R
Practical Williams %R analysis for indices, combining momentum context and real-world chart examples
The Williams %R oscillator, introduced by Larry Williams, was created to quantify momentum by showing where price closes relative to its recent range. Rather than predicting direction, it highlights over-extension and loss of momentum, making it especially effective in liquid, mean-reverting markets such as equity indices.
This implementation applies dual lookback periods (13 and 52) to evaluate short-term and broader momentum simultaneously. Signals are generated only when both oscillators align in overbought or oversold areas, confirm directional momentum via slope, and agree with candle bias, filtering out isolated or counter-context readings. The indicator is designed primarily for index markets, where momentum compression and mean reversion play a significant role.
How the indicator generates signals
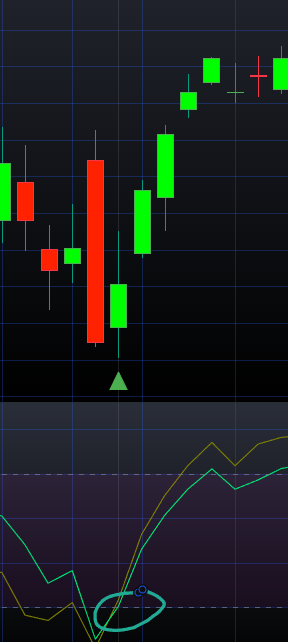
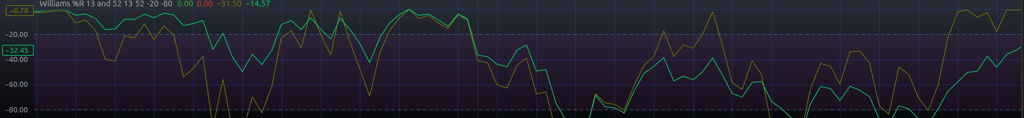
For bullish scenarios, the indicator generates a signal whenever the 13-period and 52-period Williams %R cross over the lower horizontal line and the current candle closes bullish, in the default instance it being -80. Conversely, the indicator generates bearish signals whenever the closing candle crosses under the higher horizontal line, in the default instance it being -20.

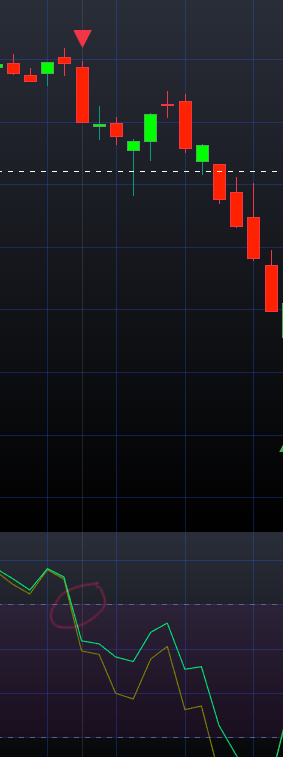

Bearish
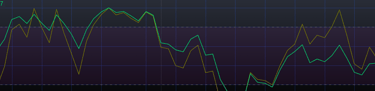
Bullish
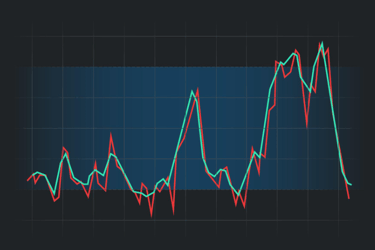
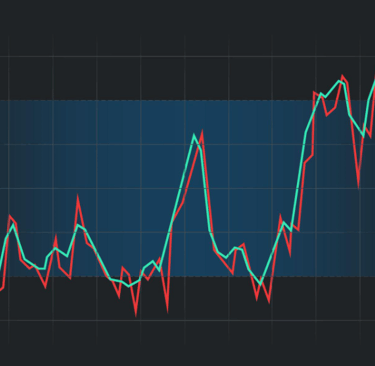
These images illustrate the indicator in action. Both oscillators have to crossover/crossunder the higher/lower lines and the candles close bearish or bullish. Below is an illustration of the indicator in a bigger picture:
Effectiveness of the indicator
This indicator is most effective when used on higher timeframes on index markets, such as the SPX, NDX or FTSE100. The oscillator shows the momentum of the price from two different periods, 13 and respectably 52. It is important to note that the indicator does not show absolute results. As with many indicators in trading, there will be many instances where the indicator is successful in one trade, but unsuccessful in another. The reason why it's a suitable indicator for higher timeframe index analysis is due to their consistent long-term upward drifts, which increases the probability of overbought/oversold levels to be respected.
Limitations of the indicator
One big limitation of this indicator is that we cannot tell for how long an instrument will stay overbought or oversold. Hence, it cannot be guaranteed that the periods will, for example, cross under the higher threshold and remain there. This can be observed in the illustration above.
Another limitation of this indicator is that, although we have bearish signals, they might be false or incorrect signals, as we are using this indicator on long-term investing indices. These indices are not as volatile as, for example, stocks or Forex pairs, making the indicator weaker for bearish moves.
Indicator is simple and intuitive to use. In terms of trading application, this indicator works best as a confirmation tool, rather than a standalone strategy. The indicator can be paired with other indicators, such as Moving Averages, Volume or other technical analysis tools which may suit you. The indicator is free to use and will be included at the bottom of this page.
Practical Usage
Disclaimer
This indicator is provided for educational and analytical purposes only. All signals are based on historical price behaviour and do not guarantee future performance. Always apply independent analysis and appropriate risk management.