Mastering Candlestick Pattern Detection: A Complete Guide with Examples

Candlestick patterns are one of the most widely used tools in technical analysis. They visualize market sentiment and can indicate potential reversals or continuations in price action.
Nexo Mechanics introduces an advanced TradingView indicator that detects 13 classic candlestick patterns, validates them using volatility filters, and displays them directly on your chart.
We’ll break down every single pattern with explanations and example screenshots, so you can understand both the theory and how it looks in real market conditions.
Please note that these are not proprietary patterns devised by Nexo Mechanics, but rather patterns recommended by Nexo Mechanics to maximise trading solutions and to give you the best available tool in your arsenal, in order to become a profitable trader and investor.
How the Indicator Works
Nexo Mechanics’ Candlestick Pattern indicator goes beyond simple pattern recognition:
- ATR-Based Validation: Filters out low-volatility candles by comparing the candle’s range against an ATR multiple.
- Optional RSI Filter: Bullish patterns are only shown when RSI is below a specified oversold level. Bearish patterns are only shown when RSI is above an overbought level.
- Custom Thresholds: Doji Body Threshold controls how small the candle body must be to qualify as a Doji. Marubozu Wick Threshold controls how small the wicks must be to qualify as a Marubozu.
Bullish Patterns
Inverted Hammer
A single-candle reversal pattern with a small body and long upper wick after a downtrend. Shows buyers testing the upside after a selloff, signaling a potential trend reversal. Validated only if the range meets the ATR threshold and RSI is low (if filter enabled).
Bullish Engulfing
A large bullish candle fully engulfs the previous bearish candle. Signals a strong shift from sellers to buyers, often seen at market bottoms.
Morning Star
A three-candle pattern: bearish candle, small indecision candle, strong bullish candle. Signals exhaustion of sellers and fresh buyer momentum.
Piercing Line
After a bearish candle, the next bullish candle opens lower but closes above 50% of the prior body. Shows buyers regaining control mid-downtrend.
Three White Soldiers
Three consecutive long bullish candles with small wicks after a downtrend. Signals strong bullish reversal momentum.
Rising Three
A bullish continuation pattern: large bullish candle, several small pullback candles, followed by another bullish candle. Signals healthy consolidation before continuation.
Bearish Patterns
Pin Bar
A single-candle pattern with a long upper wick showing rejection of higher prices. Sellers stepped in aggressively at higher levels.
Bearish Engulfing
A large bearish candle engulfs the previous bullish candle. Signals a strong shift from buyers to sellers.
Evening Star
The opposite of the Morning Star — signals a potential top reversal. Buyers lose steam and sellers take over.
Dark Cloud Cover
A bearish candle opens above the previous bullish close and closes below the midpoint of the prior candle. Signals sudden bearish reversal.
Three Black Crows
Three consecutive long bearish candles after an uptrend. Signals strong bearish reversal pressure.
Neutral Patterns
Doji
A candle where the open and close are very close, showing indecision. The market is balanced — potential reversal if at extremes. Doji body size is controlled by your custom threshold.
Marubozu (Green and Red)
Candles with almost no wicks, showing strong directional conviction. Momentum candles often seen at breakouts. Wick size must be below your Marubozu threshold.
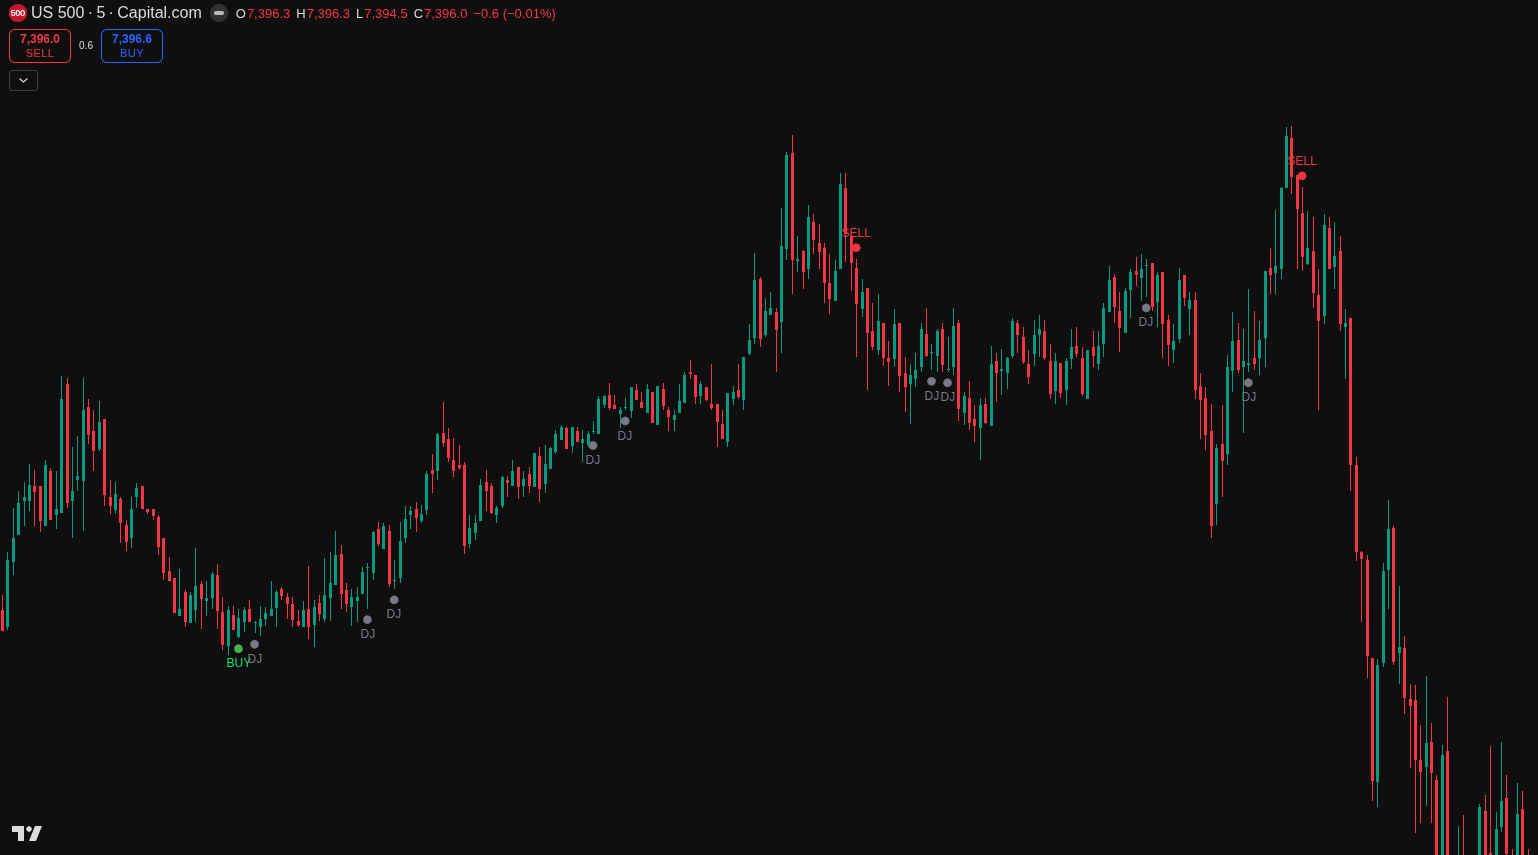
Chart Display and Labels
Patterns are colour-coded on the chart:
| Colour | Meaning |
|---|---|
| Green | Bullish patterns |
| Red | Bearish patterns |
| Grey | Neutral (Doji) |
| Green / Red | Marubozu labelled with corresponding colour |
Practical Trading Tips
- Combine candlestick pattern signals with overall trend direction for higher accuracy.
- Use ATR and RSI filters to eliminate noise in choppy markets.
- Backtest different Doji and Marubozu thresholds to align with your trading style.
- Treat candlestick patterns as confirmation tools, not standalone signals.
Conclusion
The Nexo Mechanics Candlestick Pattern Indicator makes classic candlestick analysis more systematic and data-driven by combining pattern recognition with volatility and momentum filters.
Whether you are a beginner learning market psychology or a professional trader fine-tuning entries and exits, the indicator offers a significant edge by turning subjective candlestick reading into an objective, rules-based system. By integrating advanced pattern detection into your strategy, you gain a reliable visual representation of price action and deeper insight into market sentiment, helping you make informed, profitable trading decisions.